chart
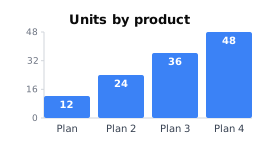
A bar chart drawn from a bound array, with an optional title, axis and value labels.
When to reach for it
Against table-v2 over the same array, the deciding factor is what the reader needs: a chart when relative size and shape carry the message, a table when the exact figures do. A chart has no static mode, so it needs a schema array bound through bindingField, labelKey and valueKey.
Worth knowing
Bar is currently the only chart type, and a newly added chart arrives pre-bound to an array named items with description and quantity keys that may not exist in your schema.
Properties the tour sets
Only what the Component Tour changed from this element's defaults — everything else is left as-is. It sits in the report-header band.
| Property | Value |
|---|---|
bindingField | products |
labelKey | name |
valueKey | units |
title | Units by product |
Open the Component Tour → to see this element alongside all the others.